
by Francisco Kraefft on 9 Nov, 2023
In today's digital age, data is king. For us digital marketers and advertisers, having access to accurate, comprehensive, and real-time reports is crucial for making informed decisions and optimizing our strategies.
That's where Google Looker Studio comes in. This powerful tool allows us to customize and create dynamic reports and dashboards, integrating seamlessly with most platforms for enhanced insights.
Looker has empowered us to make informed client decisions and assess our performance. It allows us to seamlessly integrate all the platforms and channels we utilize for our marketing strategies, enabling us to compile comprehensive information and make data-driven decisions. So, let's dive in!
Getting Started with Looker Studio: A Guide for Reports
Using Looker Studio, we can easily visualize and analyze data from various sources, such as organic channels like SEO or paid channels like Google Ads, in a user-friendly interface that makes data analysis a breeze. One of the significant advantages of Looker Studio is its capability to seamlessly merge multiple reports, resulting in more comprehensive and valuable insights. We can easily choose from various visualization options, charts, graphs, and interactive dashboards to present our data meaningfully.
The great thing about this tool is that it can be used by anyone, regardless of their technical expertise. The challenge lies in deciding what information to show and how to present it effectively.
In addition to its basic features, Looker Studio offers advanced capabilities such as data segmentation and filtering. These features allow us to dive deeper into our data and uncover valuable insights to drive business growth.
Another advantage of Looker Studio is its ability to easily share the report with teammates and customers and even send monthly email updates. This ensures that everyone is well-informed and aligned when it comes to performance.
Looker Studio is a valuable tool for digital marketers and advertisers looking to optimize their performance. Its powerful and versatile data visualization and reporting capabilities make it a must-have tool in any marketer's toolkit.
What should a Looker Studio report have?
Take a sneak peek into our approach to creating Google Ads Ecommerce reports and the key metrics we analyze.
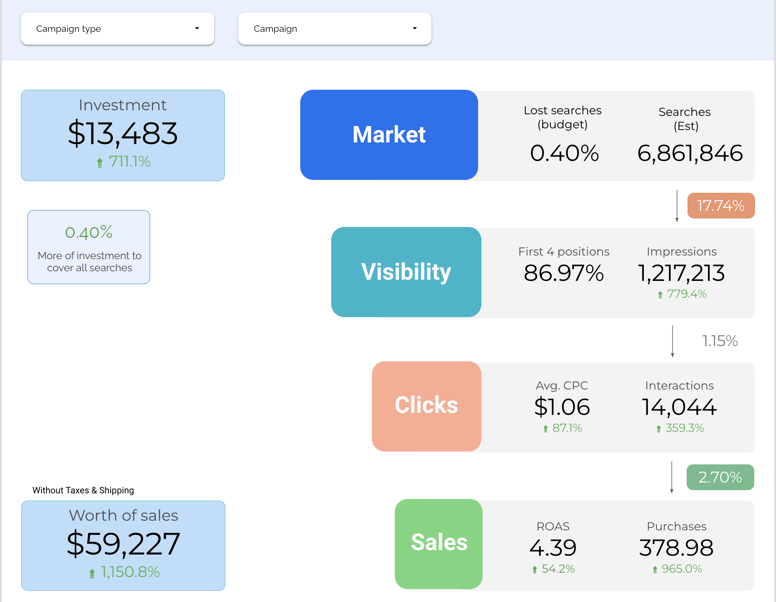
Based on our expertise, a comprehensive Looker Studio report should include market analysis, ad performance, user behavior, and sales data.
Market: In the presented scenario, we analyze the volume of searches conducted during the specified time frame and quantify the lost opportunities resulting from budget limitations.
There is no reason to impose restrictions if the marketing strategy is profitable. Instead, we encourage customers to increase their budget to capitalize on the success further by bringing more sales while maintaining the same return on ad spent.
Ad Performance: When it comes to it, our primary focus is on two key factors: our search rankings and the number of clicks we receive. This information provides valuable insights into how we stack up against our competitors and whether our messaging in search queries resonates with users.
User Behavior: When analyzing user behavior, we focus on two key factors - the average cost per click (CPC) and the interactions with our ad. This valuable information allows us to gauge the effectiveness of our strategy and determine its profitability.
For ecommerce campaigns, we estimate that it takes approximately 40 clicks to make a sale, which means a conversion rate of 2.5%. By multiplying the number of clicks by the average CPC, we can evaluate the conversion cost of the campaign for our customers and thus know the price per sale early in the campaign.
Sales: When it comes to ecommerce, analyzing sales is straightforward. We examine the total number of sales, return on ad spend, and sales value. This allows us to compare sales figures with previous periods, assess campaign profitability, and determine the revenue generated. Regularly monitoring these metrics will enable us to track growth and make data-driven decisions to optimize our marketing strategies.
Include a comprehensive analysis of all channels and associated costs in the reports!
In addition to creating individual reports for each channel, whether organic or paid advertising, it is highly recommended to have a comprehensive report that combines all the data.
Running a business involves numerous hidden costs, such as agency fees, community managers, and budgets, which should all be considered when calculating returns. By including these factors in the reports, you can make more informed decisions for your marketing campaigns and maximize your results.
Contact us to have your report and make informed decisions for your business.


